Expert Insight, Breaking News, and Insider Stories on Real Estate in Paris

How has the price of Paris real estate evolved over time?
Paris real estate has been an incredible investment over the past decades, rising dramatically in value since the early 1990s. The average price in some arrondissements has doubled, tripled or even nearly quadrupled over the last 25 years.
Not all of Paris’ arrondissements saw price growth in 2016, but all have seen massive growth since 1991. A shrewd acquisition then and sale now could earn three and a half times the original investment.
The graph below shows the index price gain across the capital since 1980. Several dips took place during the early 1990s recession, the 2008 financial crisis, and most recently during the Eurozone crisis of 2011.
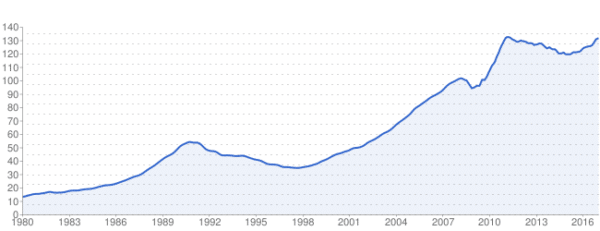
Price growth in Paris © Meilleursagents
The property market in the capital only fully recovered from the latest crisis in 2015 and 2016, with prices recently reaching their 2011 record according to market observatories (though this is still to be confirmed by the Notaires).
The table below shows the average price per m2 (€) for each arrondissement over the last 25 years (Notaire statistics).
| Arrondissement | 1991 | 1996 | 1999 | 2007 | 2009 | 2013 | 2016 |
|
1st
|
4 600
|
2 590
|
2 990
|
7 800
|
8 050
|
10 400
|
10 000 |
|
2nd
|
2 760
|
2 020
|
2 400
|
6 610
|
6 720
|
9 610
|
9 830 |
|
3rd
|
3 310
|
2 360
|
2 580
|
7 170
|
7 220
|
10 190
|
10 690 |
|
4th
|
3 990
|
2 900
|
3 220
|
7 920
|
8 260
|
10 930
|
10 920 |
|
5th
|
4 210
|
3 010
|
3 440
|
7 960
|
8 220
|
10 420
|
10 730 |
|
6th
|
4 960
|
3 290
|
4 120
|
9 210
|
9 330
|
12 320
|
12 200 |
|
7th
|
4 850
|
3 310
|
3 930
|
8 650
|
8 860
|
11 910
|
11 530 |
|
8th
|
4 270
|
2 860
|
3 310
|
7 600
|
7 770
|
9 950
|
9 580 |
|
9th
|
2 800
|
2 080
|
2 320
|
6 220
|
6 320
|
8 760
|
9 120 |
|
10th
|
2 430
|
1 750
|
1 840
|
5 400
|
5 560
|
7 680
|
8 210 |
|
11th
|
2 640
|
1 970
|
2 180
|
5 860
|
6 030
|
8 190
|
8 570 |
|
12th
|
2 860
|
2 190
|
2 310
|
5 840
|
5 910
|
7 880
|
7 830 |
|
13th
|
3 050
|
2 190
|
2 310
|
5 770
|
5 750
|
7 750
|
8 000 |
|
14th
|
3 350
|
2 470
|
2 670
|
6 310
|
6 470
|
8 520
|
8 570 |
|
15th
|
3 480
|
2 560
|
2 770
|
6 440
|
6 400
|
8 640
|
8 620 |
|
16th
|
4 410
|
2 940
|
3 280
|
6 990
|
7 120
|
9 220
|
9 130 |
|
17th
|
3 050
|
2 230
|
2 430
|
6 110
|
6 290
|
8 390
|
8 930 |
|
18th
|
2 320
|
1 780
|
1 840
|
5 290
|
5 380
|
7 310
|
7 810 |
|
19th
|
2 470
|
1 760
|
1 790
|
4 910
|
4 900
|
6 730
|
6 920 |
|
20th
|
2 460
|
1 890
|
1 920
|
5 180
|
5 200
|
6 990
|
7 270 |
Note: these prices are average net-to-seller prices that do not reflect agent commissions, closing fees or list prices.
This translates into the following map of price growth across the capital. The fastest growing arrondissement, the 2nd, went from €2,760/m2 to €9,830/m2 over the period. This means a €400,000 apartment bought in 1991 would today go for €1,400,000, an average annual appreciation of around 10% (not including the phenomenal price growth seen so far in 2017).

Price growth in Paris 1991 – 2016
sources: Paris Notaires and Meilleursagents
Contact Paris Property Group to learn more about buying or selling property in Paris.


